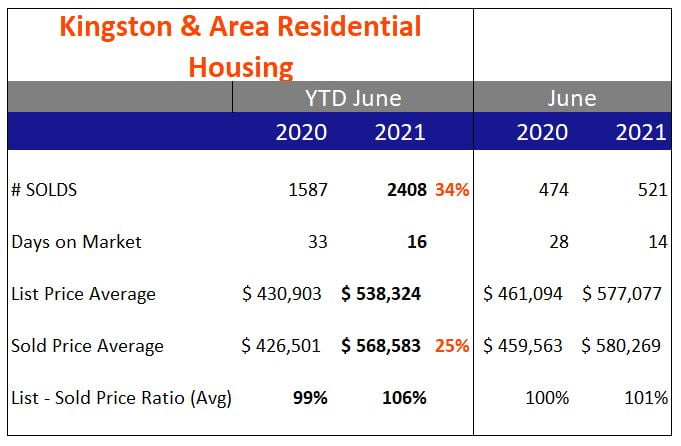

As I suspected last month, Kingston & Area has seen a change in the local markets. Although sales were higher than expected, the List to Sell ratio has dropped to 101%. We haven’t seen this since last November. We hit an all time high of 109% in May so June’s number is a nice surprise for BUYERS. Yes, Sellers may not be as pleased with this. This number represents how much over and under the list price the home sold for. The last time we saw this number under 100% was in May 2020.
Another indicator is Days On Market (DOM). This as well did creep up a bit and I suspect that July will see this increasing again. June’s number was 14 DOM which is the highest since February. The average for all of 2020 was 28 DOM.
Average Sale Price is lower then last month as well.
This could all be due to summer holidays and I suspect that buyers are all too tired of the games. This is not to say that “offer presentation day” has gone away. But it has started to subside. We are seeing price changes, offer presentation day with no offers, fewer showings, fewer offers.
I’m hoping for more successful offers by my buyers this summer.